
When the Virginia Tech Helmet Lab released its long-awaited helmet ratings for equestrian helmets last week, interest in the results was coupled with an avalanche of questions from riders and consumers, including those who expressed shock over the findings. Some popular helmets rated poorly in the study’s assessment of concussion risk, while certain bargain helmets—the second-highest ranked helmet costs only $58—punched far above their weight.
“Standards for equestrian helmets are typically based on severe impacts,” said Stefan Duma, the Harry Wyatt Professor of Engineering and the Helmet Lab’s founder, in a statement with the U.S. Hunter Jumper Association. “What we found is that a lot of riders come off at lower velocities, and many helmets are too stiff to effectively cushion those softer impacts. The helmets that perform better are able to deal with different energy levels.”
Equestrians account for 50,000 trips to the emergency room for concussions and other brain injuries annually, according to statistics from the Centers for Disease Control and Prevention—more than any other American sport—quickening the necessity for improved helmet safety.
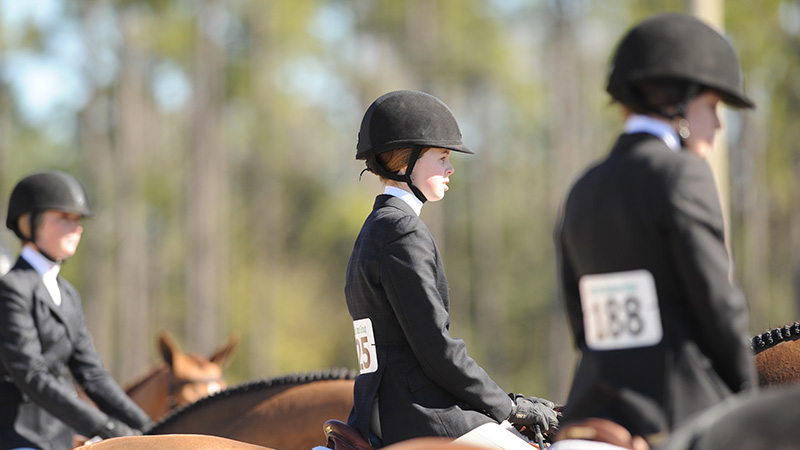
Equestrians account for 50,000 trips to the emergency room for concussions and other brain injuries annually, according to statistics from the Centers for Disease Control and Prevention. Independent helmet testing is intended to help consumers and manufacturers alike determine the best helmets and best designs for preventing concussions. Mollie Bailey Photo
“A lot of these helmets don’t test well right now, but we expect the manufacturers to make improvements,” Duma said. “That’s going to be better for consumers as well as manufacturers. Ultimately, we hope to reduce the number of injuries.”
There’s much to interpret and decipher from the equestrian ratings—and much non-scientists don’t intuitively understand about the testing process. So, we asked Dr. Barry Miller, director of outreach and business development for the Helmet Lab, to answer some of the main questions readers raised in the wake of the ratings’ release.
Our interview covered a lot of ground, so we’re publishing it over two days. Today, we’ll discuss how to interpret the scores, get answers to commonly asked questions about the Helmet Lab’s testing protocols, and get Miller’s take on why helmets with MIPS technology performed the way they did. Come back tomorrow for more on helmet fit and other issues, including the most important factors to keep in mind when shopping for a helmet. (Read Part 2 of this interview.)
The interview has been lightly edited for clarity.
You tested 40 helmets from 15 different brands. How did you determine which brands and helmets to choose, and how soon do you expect to add more?
We tried to pick a variety of manufacturers and models in various price ranges to include in the initial ratings. I thought we did a great job getting 40 models because we had a lot of supply chain and inventory issues. We used four samples of the exact same size with the exact same finish, and so we had a lot of trouble getting that. Some of them were backordered, and we couldn’t get them in time.
We will continue to add as many models as we can moving forward. This was just the initial launch. There’s lots of models to test, and we’re certainly going to include as may as we can moving forward.
Some people have been confused about the STAR (upper-case) scores versus the star (lower-case) ratings. Can you please clarify what each means?
The STAR (Summation of Tests for the Analysis of Risk) score numerically represents the average number of concussions you would get wearing that helmet model if exposed to 30 helmet impacts modeled in the lab. You want a helmet with a low STAR score because that indicates lower concussion risks.
The star rating puts the helmets into performance-based categories, similar to A, B, C, D [on a test]. In this case it’s five stars through zero stars—five stars being high, zero stars being low. Just like a math test; if you get 75 out of 100, that’s a C. So higher means better: Five stars is our A, four is our B.
[We say it is the number of concussions out of 30 impacts because] we added a multiplier of five. We do six test conditions; we do each test condition twice. We average that so you get six discrete numbers. So, three locations, two energy levels, and we have the average of each test conditions. Then we multiply that by five, to spread the scores to make them a little bit more meaningful.
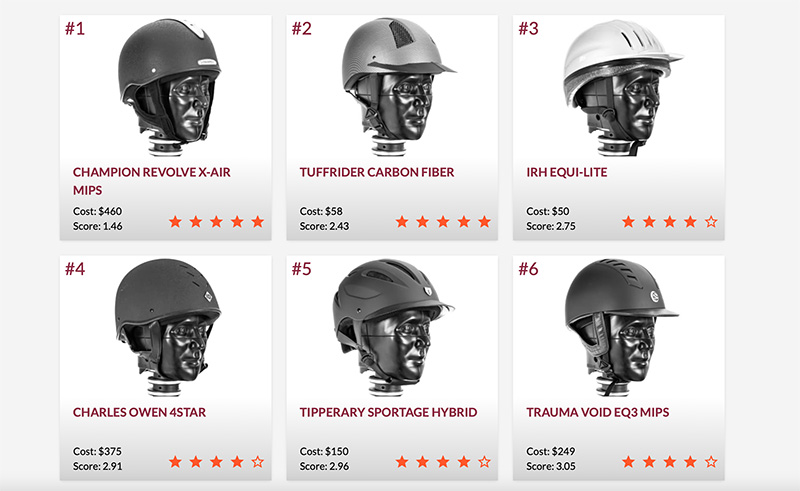
Under the Virginia Tech Helmet Lab’s rating system, each helmet receives a numerical STAR score (bottom left of each box) and a zero-to-five star rating (bottom right). The lower the numerical STAR score and the higher the star rating is, the better that helmet is at mitigating concussion risk. Courtesy Of Virginia Tech Helmet Lab
Some of these STAR scores don’t have a huge difference between them. What’s the significance of the different between a STAR score of 4.09 versus 3.65, for example?
ADVERTISEMENT
The difference is in the number of concussions. It’s the number of differences in concussions for those 30 test conditions. So if you subtracted those from each other—say it’s a four and a three—that would be a difference of 1. If you divide by 30, it would give you a percentage of difference between the helmets. It may not be a big percentage, more than likely not.
Depending on the type of riding you do, how often you do it, even one concussion could have a lifelong effect. If you ride every single day, and you’re teaching, and you’re at risk—you’re not just walking—maybe you want to make sure you find the highest performance helmet because you have a much higher exposure. So that’s going to go into your equation.
I get this question a lot with football helmets with parents: “They’re all five-star helmets, but this one has a score of 3 and that one has under 1, does that make a difference?” Well what position does he play? Does he always get hit? Is he a linebacker? Is he a running back? Is he a lineman? Is he even a starter? Every time you get on a horse there’s risk, but if you don’t get on a horse very often there’s not as much risk. So maybe the performance difference between a 5 and a 3 or even a 2 aren’t that significant for you.
Can you please walk us through the specific testing used to determine each helmet’s numerical score? First, how many times each helmet was tested, and was a new helmet used for each test or the same helmet used for multiple impacts?
We used a pendulum impactor, which isn’t commonly used in the testing world for equestrian helmets; so that’s new. We used four helmet samples for each helmet model. We do not impact the same location twice because these helmets are single impact helmets. We tested three locations at two different energy levels per those three locations—so, six test conditions—and we do those twice. It’s a total of 12 tests per helmet model using those four helmet samples.
To non-physicists like us, the video of the pendulum test looks like it mimics a horse kicking a person in the head, and not necessarily the fall that an equestrian would have. Can you walk us through in laymen’s terms how this pendulum actually accounts for both direct and rotational impact?
We evaluated on the field head impact, and the time traces of those head impacts are simulated by a test rig in the lab.
[What exactly is the] time trace of an impact? So, what is a pulse? What is the graph of a 10-millisecond hit when we drop these head forms on dirt in the equestrian arena? What does that graph look like? If you had to do a time trace for that 5 to 10 milliseconds, what are the peak accelerations? What does that look like? That’s really important. So, we want to match that time trace or that pulse impact, to a test rig in the lab. And the pendulum was the best match. So, we used the pendulum.
For a layperson watching the testing video, it still looks very linear. Where does the rotational element come into play?
Your brain is oblique shaped inside your skull, so it’s always going to have some sort of rotational movement for any given impact. We’re measuring what the head form does in response to these impacts. There’s always going to be a rotational head metric; not all the head impacts that we do are completely centric. So that means, we don’t hit the head exactly in the middle. We hit it slightly above or below; we change the angles on the head form. We impart rotation based on how we hit the head, so henceforth it’s going to rotate.
If a soccer ball hit you on the forehead, your head would rotate backwards because it’s fixed to your neck. That is rotation about the X axis. Your head would also move linearly a little backwards (although that movement would be limited anatomically), and that would be translate to the Y axis. Almost every movement has linear and rotational components to it.
What feedback—positive or negative—have you gotten from manufacturers about your ratings or testing process when you release these ratings?
Most of them just want more clarification or discussion. We haven’t had a chance to pull their helmet data and go through test by test with them just yet. But here’s the big message: The only standard they’ve had to go by were the standards of the various certifications [i.e, ASTM International, Snell]. All these standards use linear acceleration as the only metric. It’s great that all the helmets meet those certifications because that is for catastrophic head injuries, which obviously is the most important.
This next phase is, “How can we better improve helmets to protect against concussion risk?” Now that we’re including both linear and rotational head accelerations in our evaluation, that will help evolve helmets to the next level of performance—because we know that rotational head accelerations are significant contributors to concussions.
One of the startling things about your rankings was the varied performance of MIPS (multi-directional impact system) helmets, which are widely regarded as the new gold standard in helmet safety. The best-performing helmet in your rankings was a MIPS helmet, but so were four of the 10 worst-ranked. Can you explain this?
ADVERTISEMENT
MIPS is one of several rotation-mitigating technologies designed to help the helmet “de-couple” from your head. These technologies allow the helmet to move independently of your head for even just fractions of a second, which is a good thing. MIPS does this by providing a plastic liner that acts as a slip plane. These technologies are hoping to increase the duration of the impact and reduce some rotational head movements, which in turn reduces the peak rotational head accelerations, which then reduces injury risk. So if you were to hit your head on the ground, the helmet would de-couple and move a little independently before the impact eventually moves both your head and helmet.
Having a full head of hair acts like a natural slip plane as it helps de-couple your head/helmet. This is easily observed as you can easily rotate the helmet while keeping your head still.
The efficacy of MIPS may be heavily influenced by the specific type of test rig used (drop tower, pendulum), the type of head form used (differing levels of friction), hair/no-hair, use of surrogate neck, and the specific location and energy level of a given impact. All of those are going to play a role in how a rotational technology like MIPS performs. If you’re imparting a high degree of head rotation with the test rig used and location tested, along with a high friction head form (tight coupling), helmets with a rotational technology would likely be improved. The big question is whether MIPS would further enhance a helmet’s performance over and above a full head of hair. It is thus dependent on the factors described above.
My take is a good helmet is still a good helmet; bad helmets are still bad helmets. I would choose a helmet with MIPS if the price was comparable and it’s a high-rated helmet.
Why did you choose those three areas to hit the helmet? And why did you choose those two specific velocities to hit them?
Based on a bunch of research and analysis of video falls, those three locations tended to be pretty common and representative of most head impacts: front, side, back. You might have some combination, but those are representative. The energy levels were determined by some of the certification standards, our research of how if you fall from your horse, what does that energy look like—so based on how high you sit on a horse. And then the low energy was determined because we know that people are getting concussed at lower energy impacts with no helmet damage.
This was in several research papers, but there’s lots of injuries at lower energy impacts, and so we chose a lower energy threshold to use as our metric. If you read the methodology paper, we weighed it three times as much because it happens three times as often according to the research. If you think about horse riders, granted the ones that get the most press are the ones that fall off and get injured at hunter/jumper or eventing activities. But just think about how many people are just walking around—you’re walking your horse, he gets spooked, and you fall off and hit your head. [That’s] low energy. Or you’re just walking down the asphalt to get into the arena and the horse stumbles, and you fall off the horse.
Or you brace yourself enough that when you hit the ground, it’s lower energy. By the time you hang on, the horse is slowing down and you hit your shoulder first and then your head—you dissipate a lot of energy.
There’s lots of those lower energy impacts, and we wanted to make sure we captured that because they represent lots of concussions in the equestrian world.
MIPS released a statement last week questioning several aspects of your testing methods—including that your testing protocol doesn’t account for “tangential force”—and suggesting these may be the cause for MIPS helmets performing more poorly in your testing than they have in tests conducted by an insurance company in Sweden. Can you reply to this?
The research we did with advanced video analysis of the 100-plus falls did not indicate a large forward velocity (tangential component). Additionally, the current published literature did not quantify the forward velocity for the injuries reported and thus we could not include that with our testing protocol.
Our STAR ratings have the flexibility to evolve, so if/when this data is produced we will certainly review and proceed accordingly.
We did not look at horse racing falls, which would likely have a significant forward velocity. We do have non-centric impacts to the side and the back of the head, but not comparable to our bike and snow sport helmet testing, where these forward velocities have been quantified.
When most people fall, they generally brace themselves prior to leaving the horse, hit the ground with something other than their heads first, and thus the forward velocities of actual head impacts can be significantly reduced. Quantifying these impacts are difficult without video evidence paired with injury reports.
[Editor’s Note: Representatives of Mips, the Swedish company behind the patented MIPS technology, disagree with the Helmet Lab’s testing protocols. Read their concerns about the new ratings and the tests used to create them.]
Check back tomorrow for Part 2 of this interview, with Dr. Miller’s answers to questions on helmet fit, the correlation (or lack thereof) between price and quality, concussions sustained in high- versus low-energy falls, and the most important factors to consider when shopping for your next helmet.